Arui.AI is a data flow diagram maker that converts plain-language descriptions of processes, data stores, and data flows into structured DFDs in roughly 6 seconds per output. Type out the external entities of a customer order system, list the data stores of an inventory pipeline, or sketch out a context diagram in words, and the platform returns a formatted data flow diagram ready for refinement, export, and circulation.

Three tiers tuned for label density, output sizes, and budgets — compare resolution, credit cost, and style support before you generate.

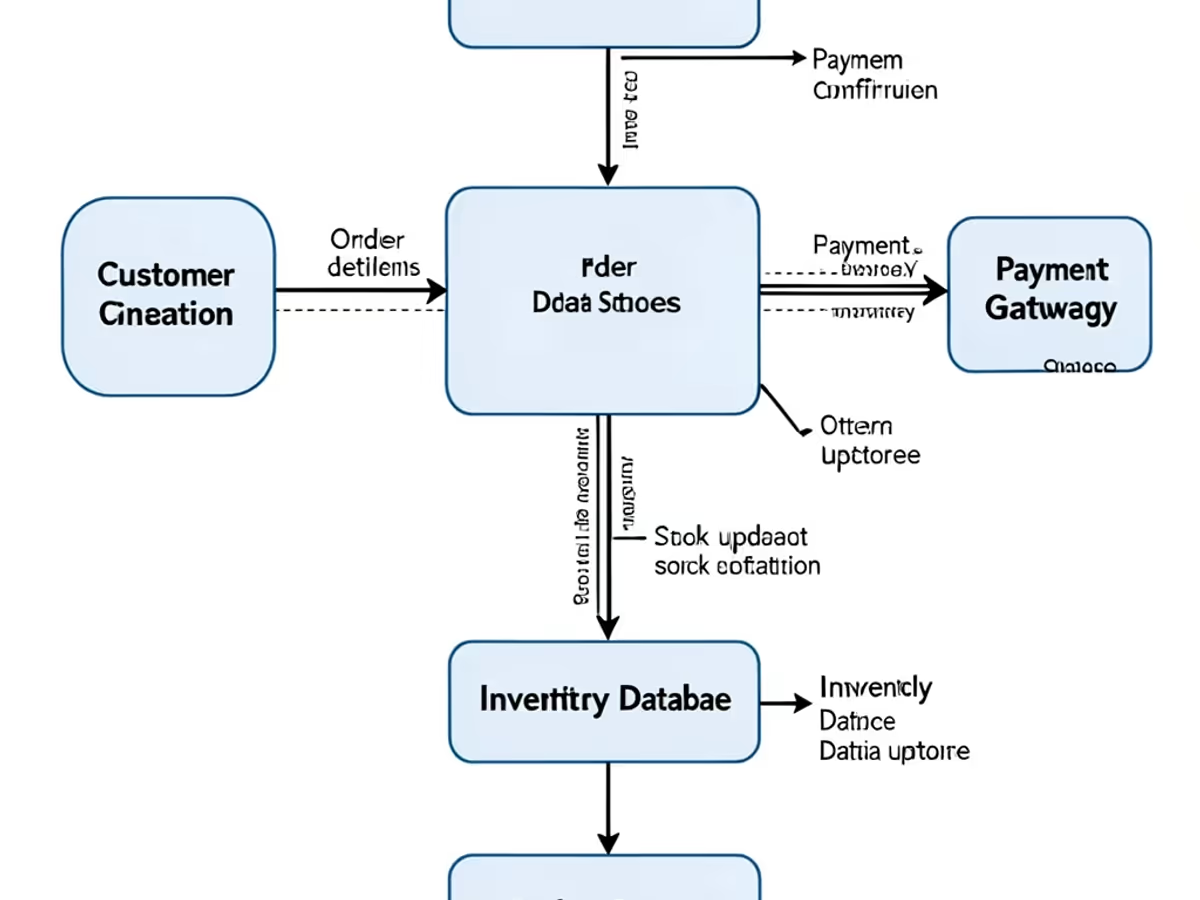
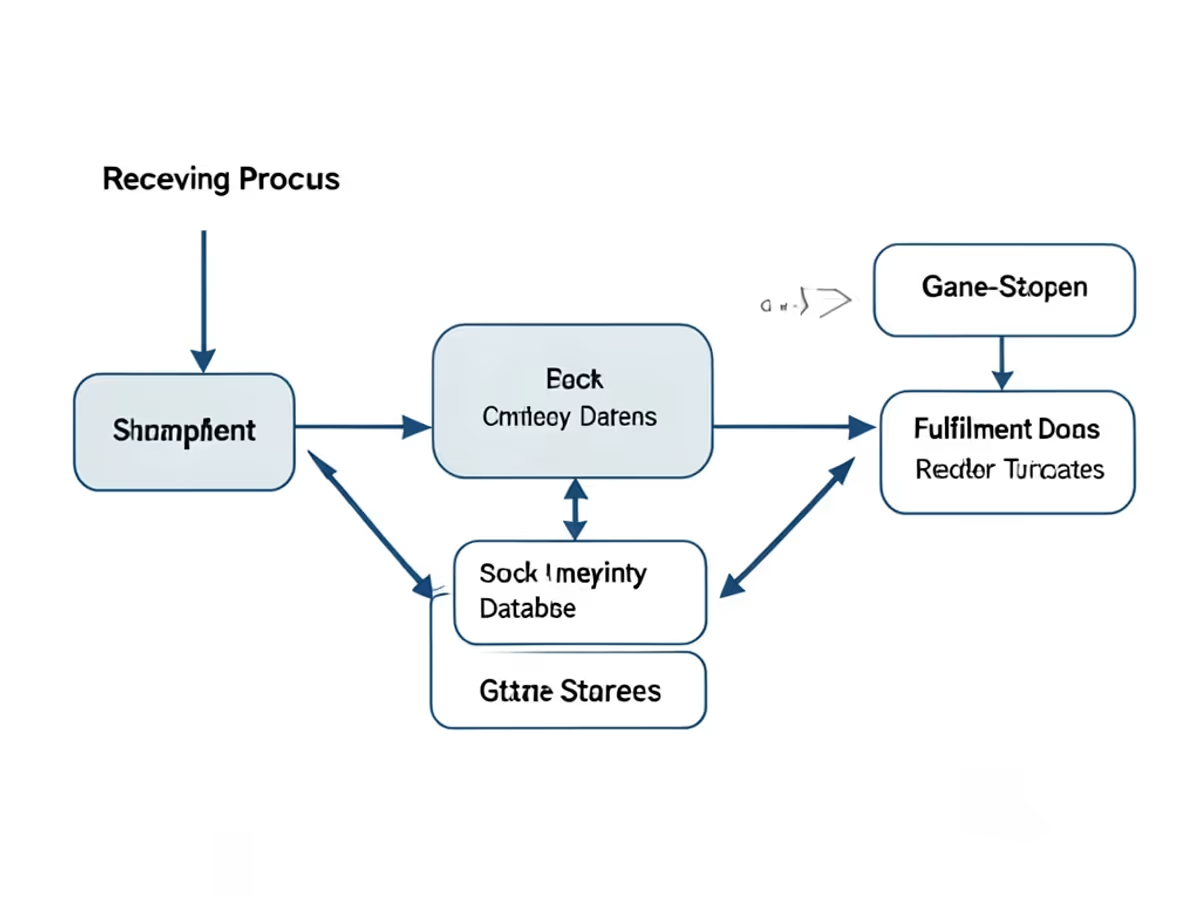
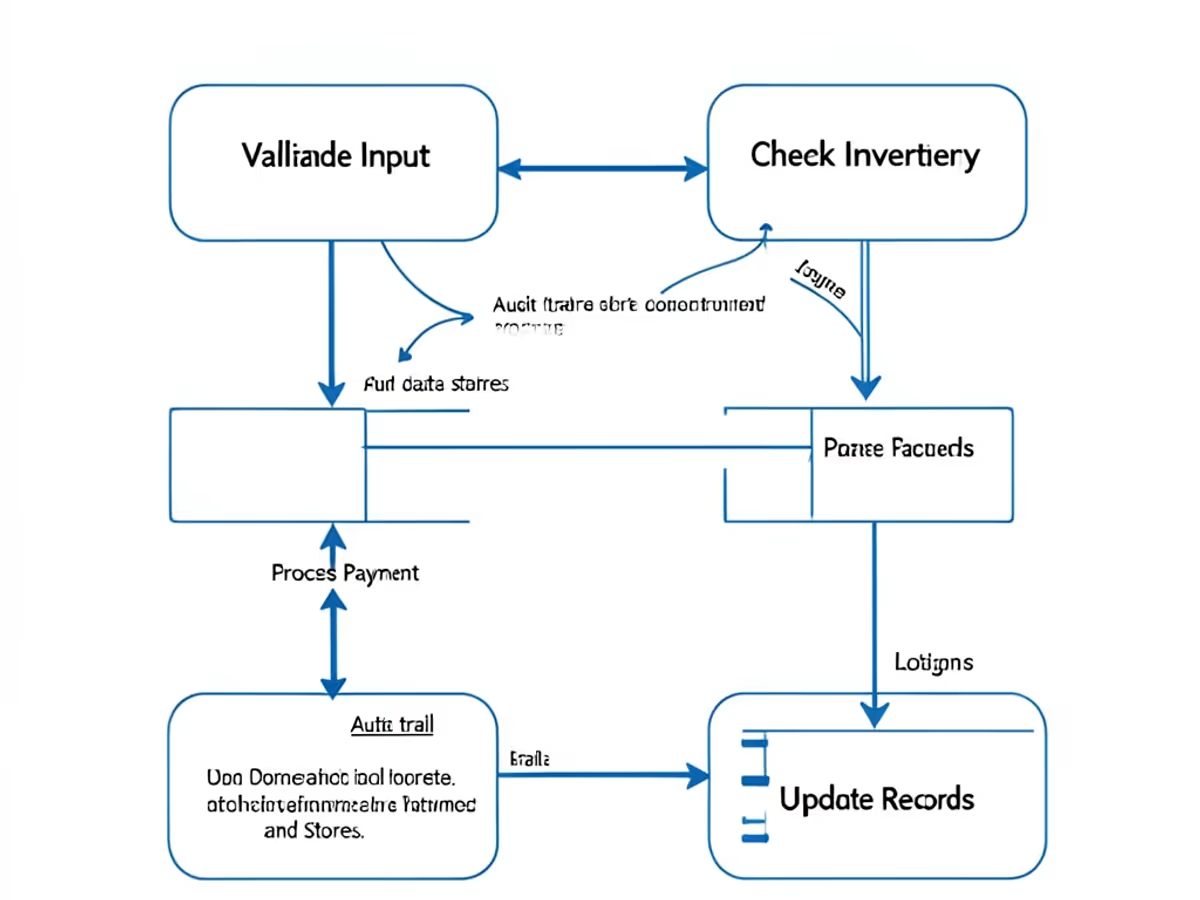
Describe the data flow in everyday language. Get a clean, labeled DFD back — no dragging shapes required.

Drop a 500-word write-up of processes, data stores, and data flows into the data flow diagram maker ai, and it returns a fully labeled DFD of 8 to 35 elements roughly 6 seconds later. Analysts moving over from manual shape-by-shape tooling watch per-chart effort collapse by up to 90 percent — what used to eat 20 to 40 minutes inside a legacy dfd diagram maker now finishes in single-digit seconds.

Feed the data flow diagram generator your process notes and it places every element in the correct layer — external entities on the perimeter, processes in the center, data stores at the base. The engine handles diagrams as dense as 16 processes and routes up to 50 data flows legibly with zero overlaps. Achieving that neatness inside a conventional drag-and-drop editor typically burns 15 to 25 minutes of pixel nudging.

The dfd diagram generator scans input for element names — Customer, Order System, Inventory Database, Payment Gateway — and pairs each with the correct Gane-Sarson or Yourdon notation automatically. It untangles cross-boundary flows and shared data stores across systems of 5 to 25 processes in seconds, finishing work that eats 10 to 20 minutes of click-by-click placement inside traditional data flow diagram builder tools.

Mention context diagram, level 0 explosion, or level 1 decomposition and the data flow diagram maker matches each scope to its proper notation set — covering 200-plus process patterns across standard DFD methodologies. Skipping the shape hunt saves 12 to 22 minutes per chart compared with the manual find-and-drop routine inside conventional data flow chart creator software.

Grab the finished artifact as a 3840-by-2160 4K PNG for posters, a vector SVG for wide banners, a paginated PDF for documentation handouts, or a slide-ready PowerPoint file. Every format keeps labels sharp, flow arrows clean, and entity boundaries intact, removing the 8 to 15 minutes of reformatting that follows most export-to-deck handoffs.

Feed the data flow diagram creator unstructured prose and it pulls out process names, data store labels, and flow directions at roughly 93 percent precision on the initial render. It also surfaces orphan flows, missing data stores, and likely naming collisions, trimming review loops from 12 to 20 minutes down to under 4 minutes — dependable enough that analyst teams roll it out without a training phase.

System documentation, requirements analysis, process auditing — the moments that justify automation.

Business analysts hand the data flow diagram maker a 200-to-500-word process brief and receive a labeled context-plus-level-0 DFD of 12 to 30 elements roughly 6 seconds later. Teams report an 88 percent drop in documentation labor — what consumed 25 to 45 minutes of manual illustration now takes under 5 minutes of quick review. Matching that clarity inside a legacy dfd diagram maker generally eats 20 minutes or more per asset.

Operations teams jot down warehouse processes in everyday prose and let the tool produce a structured dfd diagram generator output for each subsystem. A standard receiving, storage, and fulfillment flow of 10 to 25 processes across 3 functional areas renders in roughly 7 seconds apiece, wiping out 35 to 60 minutes versus manual rebuilding inside a traditional editor.

Consultants write system scope descriptions in prose and let the online data flow diagram maker emit charts for each review session. A typical single-page context diagram of 5 to 12 external entities and their data flows renders in roughly 5 seconds, wiping out 20 to 35 minutes of redraw work. Reviewers line the variants up to weigh scope boundaries, data ownership, and interface gaps without redrawing a single shape.

Compliance groups feed subprocess descriptions and data store mappings into the tool and receive a clean level 1 DFD that calls out validation steps, approval gates, and logging points. A 4-process decomposition of 15 to 28 elements maps in roughly 7 seconds, against 30 to 50 minutes of manual drawing. The engine untangles shared data stores and cross-process flows on its own — work that regularly stalls users of legacy drawing apps.

Describe the process, generate the DFD, ship the file — no drawing required.

Write down external entities, processes, data stores, and data flows in any format from a short paragraph up to 500 words. Include element names like Customer, Order System, and Inventory Database where possible. More detail in the input yields sharper placement on the first render.

Hit the generate button and the data flow diagram maker turns your text into a labeled DFD with auto-placed shapes and routed flows in roughly 6 seconds. Need a different layout? Revise the prompt and regenerate — no dragging, no reconnecting, no manual cleanup.

Review the output, adjust labels or move elements if needed, then save as PNG, SVG, PDF, or PowerPoint. Forward the shareable link to reviewers or drop the file straight into your requirements document. The full sequence — from text input to shipped artifact — wraps in under 60 seconds.

Quick answers about turning plain text into data flow diagrams with Arui.AI.
Write your process description, generate the diagram, and ship a polished data flow diagram in seconds.
Type a process description to build your first data flow diagram.

Other AI-powered diagram tools from Arui.AI — worth a look if you found this one useful.

Turn plain-text component and connection descriptions into polished circuit schematics with IEEE symbols.
Try Now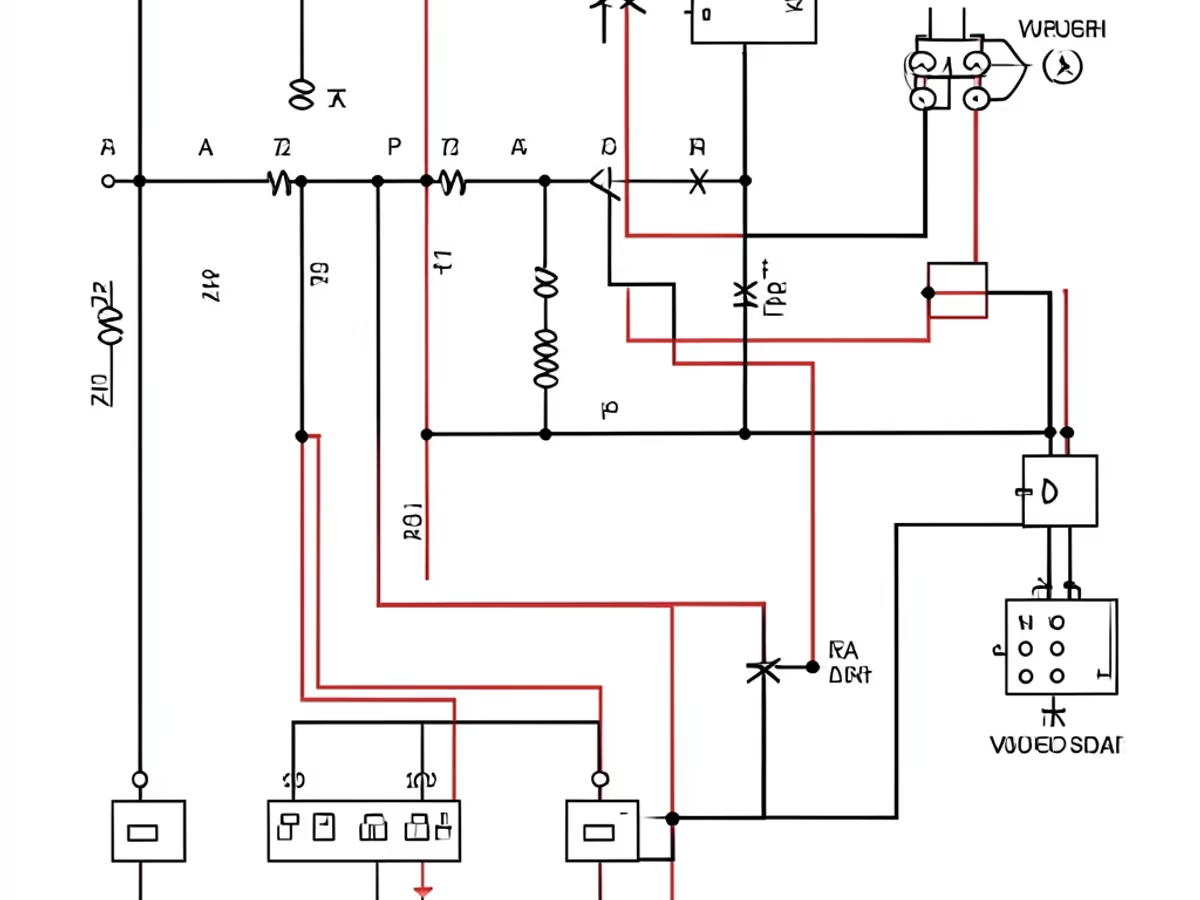
Turn plain-text service and infrastructure descriptions into polished architecture diagrams with cloud-provider glyphs.
Try Now
Turn process descriptions into structured flowcharts with AI-powered connector routing and decision diamonds.
Try Now
Turn software design specs into UML class, sequence, and use case diagrams with proper notation.
Try Now