Arui.AI is an ai org chart maker that turns written role and reporting information into visual organizational structures with correctly tiered hierarchy levels, connector lines, and department-based color grouping in as little as 8 seconds. Enter a team roster, outline your reporting lines, or paste an employee list, and the platform delivers a presentation-ready chart you can refine, download, and distribute.

Three org chart tiers tuned for different output sizes and budgets — compare resolution, credit cost, and styling before you generate.

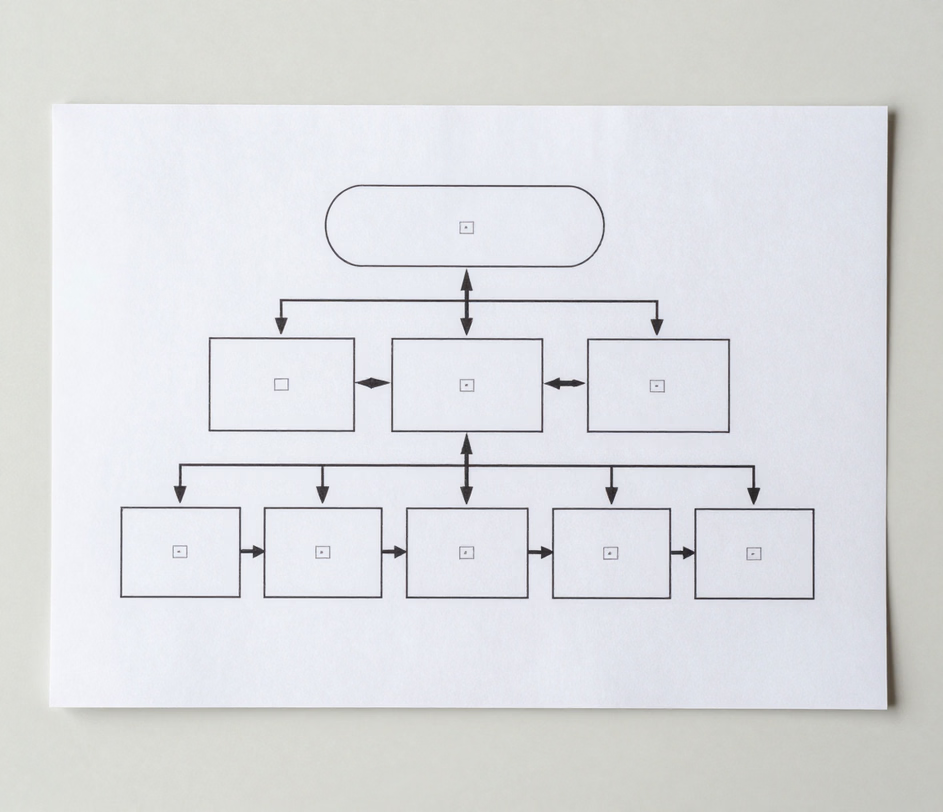
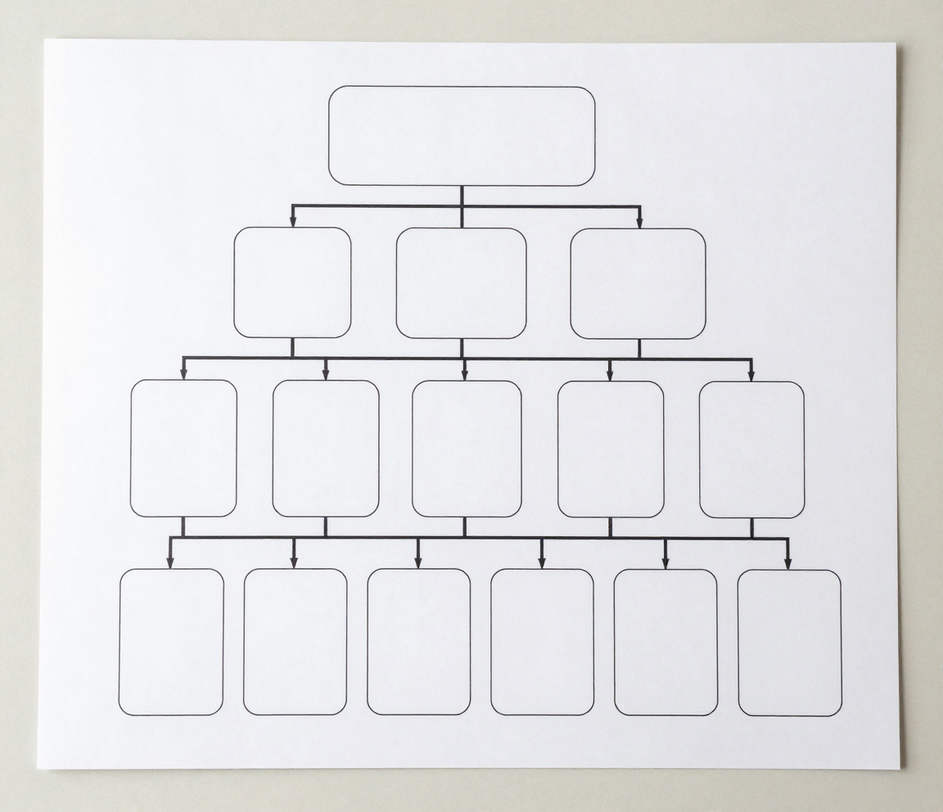
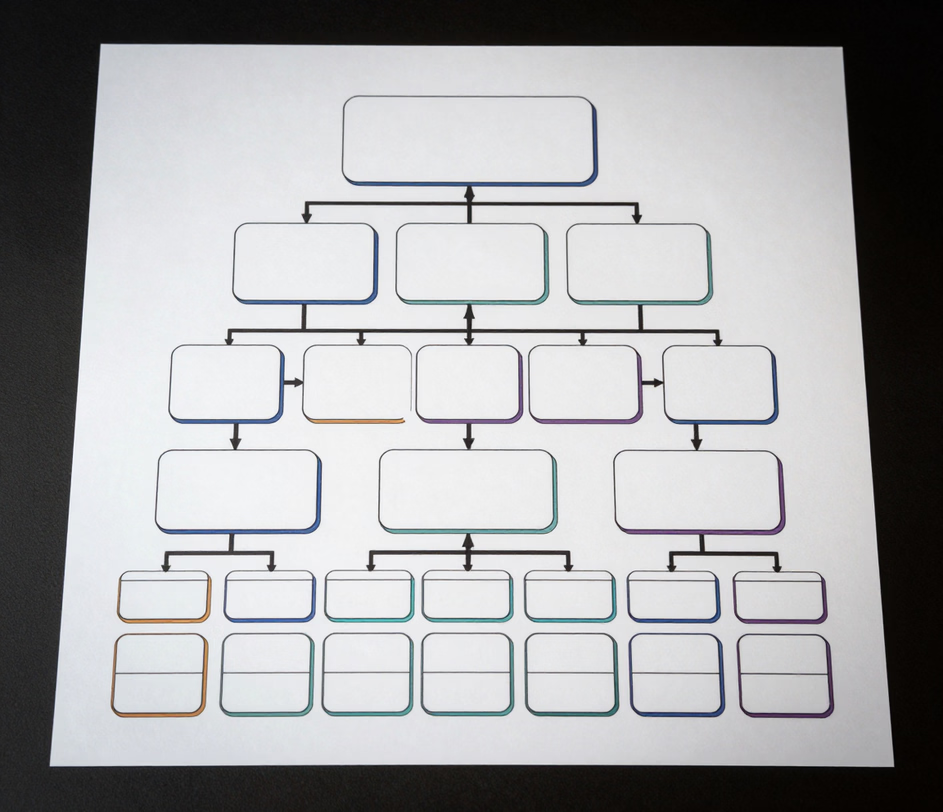
Describe your team in words and receive a complete reporting structure instantly.

Provide a written breakdown of positions, names, and supervisory links of up to 2000 characters, and the org chart generator delivers a fully laid-out hierarchy diagram averaging 20 to 40 nodes in as little as 8 seconds. Teams replacing manual drawing applications report a 90 percent reduction in production time, falling from 30 to 45 minutes down to seconds per chart.

The organizational chart generator reads your reporting data and assigns every position to the right tier with uniform vertical gaps and horizontal alignment. It accommodates up to 10 management layers and scales node dimensions on the fly, yielding legible diagrams of up to 80 boxes without collision — work that demands 20 to 30 minutes of fine-tuning inside conventional drag-and-drop editors.

The organizational chart builder scans your input text for department labels and clusters related positions into color-coded visual blocks automatically. It processes dotted-line and cross-functional reporting for organizations spanning 5 to 15 departments, completing in seconds what normally eats 15 to 25 minutes of manual grouping in PowerPoint or Visio.

Describe a vertical tree, horizontal tree, radial, or matrix arrangement right in your prompt and the structure chart maker renders that layout on the first pass, auto-positioning boxes, connector paths, and text placement without any manual dragging. Re-rendering the same team in a different arrangement takes as little as 8 seconds instead of the 10 to 15 minutes a full redraw demands in traditional software.

Download your finished chart as a crisp PNG at up to 4K (3840 × 2160) resolution on the Master tier — sharp enough for boardroom projection, printed handbooks, and large-format posters. The online org chart maker retains font clarity, department tints, and line alignment at every resolution setting, removing the 15 to 20 minutes usually lost to post-export reformatting.

The easy org chart creator renders job titles, personnel names, and supervisory chains as readable text inside each box, so a finished chart reads like a real organizational chart instead of a vague sketch. Every regeneration redraws labels and connector paths consistently, compressing the review loop from 20 to 30 minutes down to under 5 minutes. The result is an easy organizational chart maker that HR departments can trust without lengthy onboarding.

Corporate planning, HR documentation, project staffing — where automated structure creation delivers value.

Leadership teams feed 200 to 2000 characters of company information into the organizational structure chart maker and obtain a formatted hierarchy diagram containing 30 to 50 nodes in roughly 8 seconds. Organizations report an 85 percent drop in documentation effort, falling from 35 to 50 minutes of hand-drawing down to under 5 minutes of quick review. Achieving similar fidelity would mean wrestling with an organizational structure maker inside Visio for half an hour.

Department heads write out proposed restructuring options in everyday language and rely on the organization tree maker to spin up comparison charts for each variant. A standard restructuring package with 20 to 40 positions across 3 to 5 scenarios renders in about 10 seconds apiece, cutting 1 to 2 hours versus manual recreation. Reviewers toggle between organization structure maker modes to place top-down and matrix perspectives next to each other.

HR staff transform personnel rosters and supervisory data into matrix views that capture solid-line direct management alongside dotted-line collaborative reporting. A mid-size operation with 5 to 10 departments and 40 to 60 staff members maps in about 8 seconds with the hierarchy chart creator, against 40 to 60 minutes of manual labor. The org structure maker resolves dual-reporting situations and interim roles on its own — something that routinely frustrates users of conventional structure chart creator programs.

Project leads list upcoming initiative roles and oversight duties in text and obtain a clean reporting hierarchy for the new engagement. A typical project squad of 10 to 20 people across 3 tiers renders in under 10 seconds, removing the 20 to 30 minutes normally consumed by hand-drawing. The organizational structure creator doubles as an online hierarchy chart maker for agile teams, generating role-focused diagrams that reflect evolving squad compositions.

Go from written team details to a finished reporting diagram in three short stages.

Enter a roster of positions, personnel names, and reporting connections — anything from one paragraph up to 2000 characters. Cover job titles, department labels, and supervisory relationships. Richer detail in your input yields a more precise chart on the first render.

Mention your preferred arrangement — vertical tree, horizontal tree, radial, or matrix — in the prompt and press the build button. The org chart generator interprets your text and assembles a layered hierarchy diagram with auto-positioned boxes and department blocks in as little as 8 seconds. After the initial render you can make organizational chart online tweaks to any layout without starting over.

Inspect the output, shift boxes or update labels as needed, then download your chart as a high-resolution PNG. Distribute the shareable link to stakeholders or download the file for your slide deck. The whole sequence lets you make org chart online and export a finished deliverable in under 60 seconds, or make hierarchy chart online for distributed team alignment.

faq.subtitle
Write your team details, choose a layout, and export a professional hierarchy chart in seconds.
Type a team description to create your first organizational chart.

Other AI-powered diagram tools from Arui.AI — worth a look if you found this one useful.

Turn process descriptions into structured flowcharts with AI-powered connector routing and decision diamonds.
Try Now
Turn ideas and notes into structured mind maps with automatic branch detection and radial layouts.
Try Now