Arui.AI is an er diagram generator that turns written schema descriptions and SQL CREATE TABLE scripts into structured entity relationship diagram illustrations with readable entity tables, small field names, and crow's foot cardinality connectors in roughly 5 seconds. Type your table names and column definitions, or paste SQL DDL snippets — up to 500 words of input — and the platform returns a presentation-ready diagram illustration you can refine, download, and share.

Three tiers tuned for different label density, output sizes, and budgets — compare resolution, credit cost, and style support before you generate.
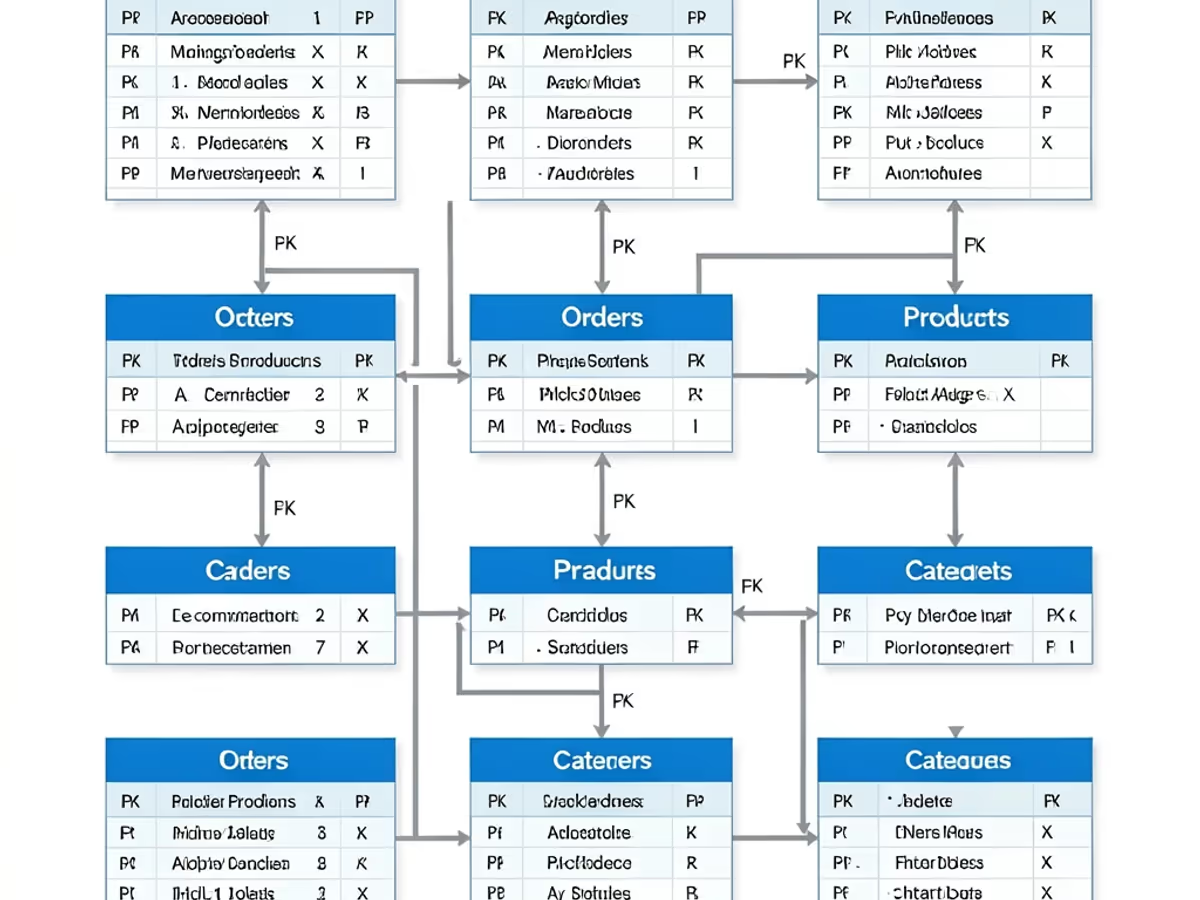
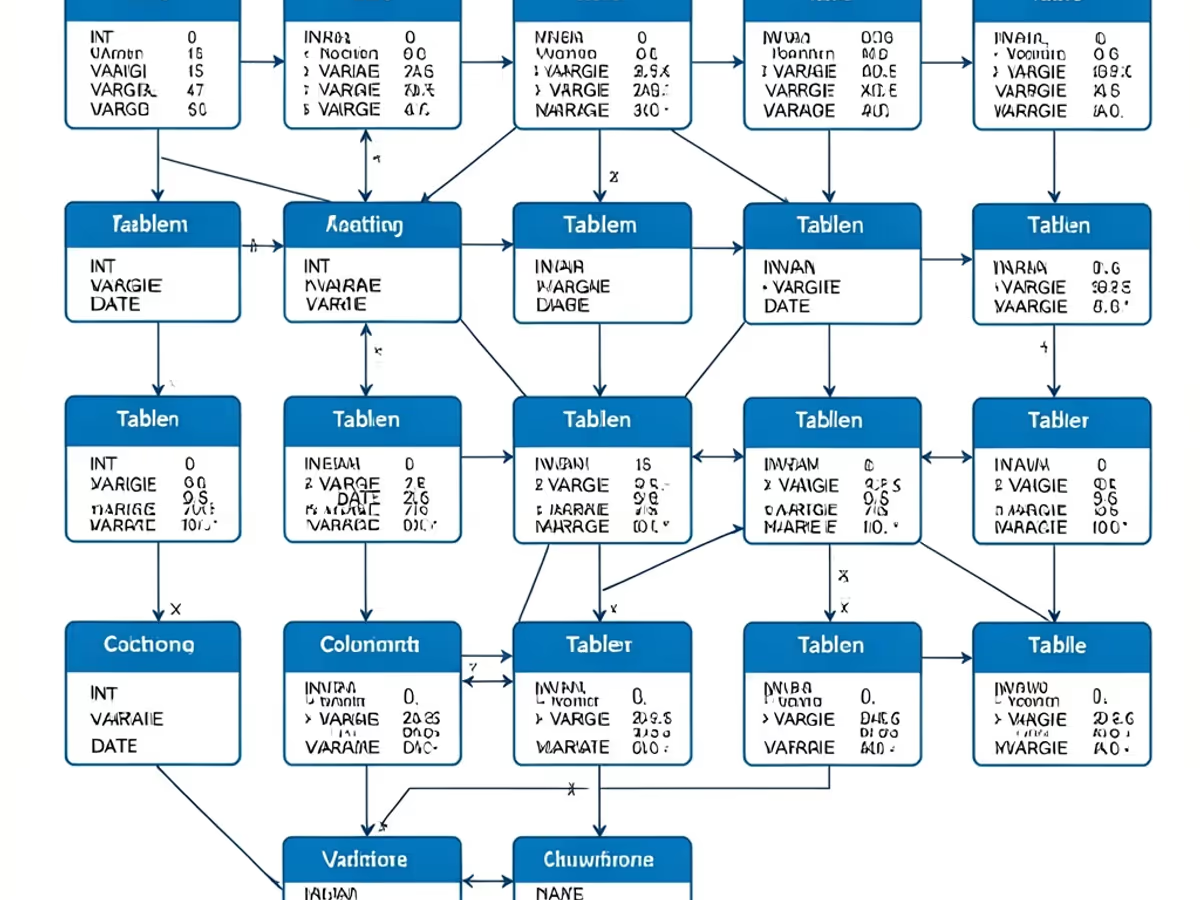
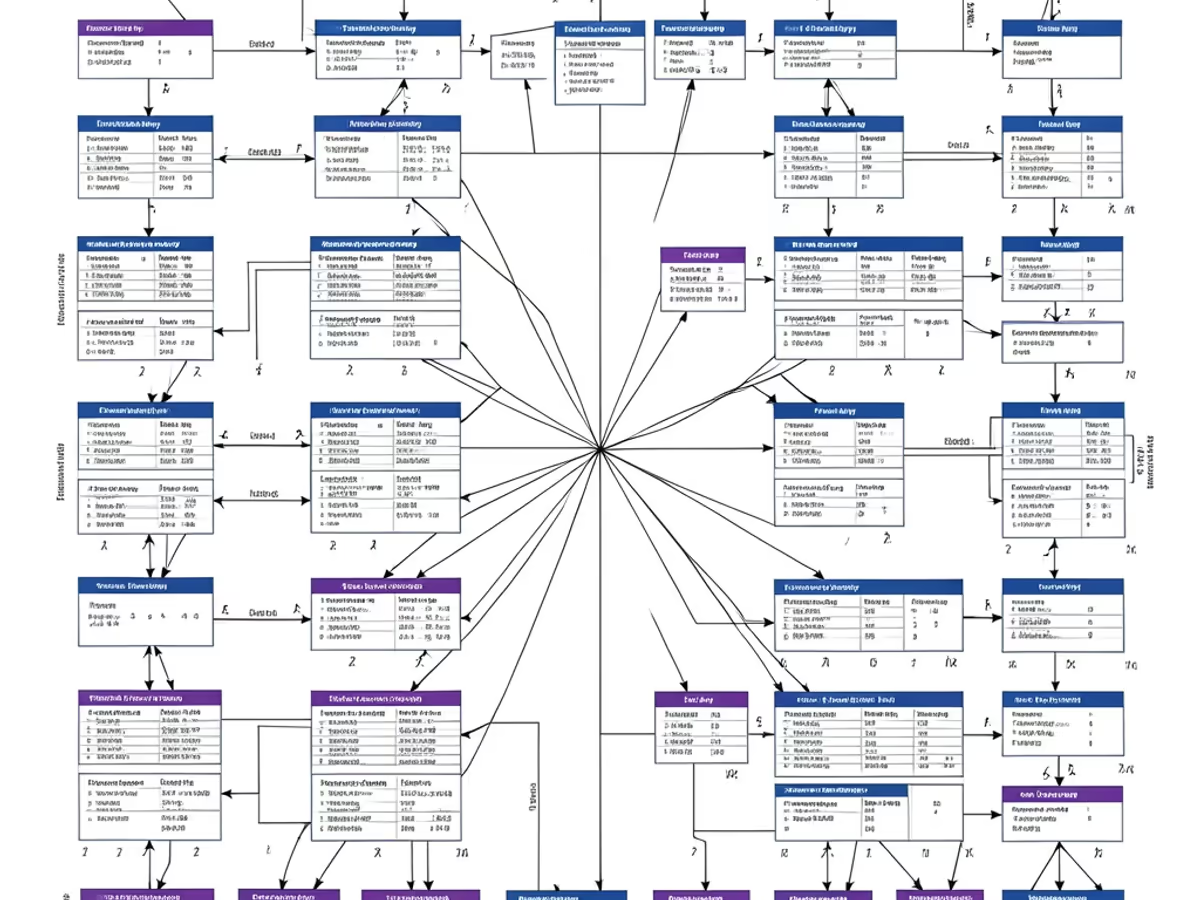
Describe your database in words or SQL and receive a formatted diagram with precise entity and relationship mapping.

Provide a written breakdown of your tables — names, columns, primary keys, and foreign key references — in up to 500 words, and the er diagram generator delivers a fully rendered diagram illustration with readable entity tables and labeled relationship lines in approximately 5 seconds. Users replacing manual diagramming tools report a 90 percent reduction in production time, dropping from 30 to 45 minutes down to roughly 5 seconds per schema.

The sql entity relationship diagram feature takes CREATE TABLE statements, ALTER TABLE constraints, and foreign key declarations straight from your DDL script — up to 500 words of input — and renders them as a complete visual schema illustration in about 5 seconds. Table names, column lists, and relationship lines are drawn from the script you paste, replacing the 25 to 40 minutes per schema that manual transcription of SQL into visual entities absorbs in legacy tools.

The entity relationship diagram generator renders one-to-one, one-to-many, and many-to-many relationships as labeled connector lines with crow's foot cardinality notation at both endpoints, following the relationships you describe in text or SQL. Junction tables you spell out for many-to-many relationships appear with connecting lines to both parent tables — labeling and placement that demand 20 to 35 minutes of careful manual work in conventional diagramming tools finish in a single pass.

The erd generator arranges schemas spanning dozens of entities on a single canvas with steady, evenly spaced blocks, keeping table names, column lists, data types, and key indicators — PK, FK — in small legible text. Producing comparable layouts in traditional er diagram design tool software demands 45 to 75 minutes of manual repositioning; the generator redraws the full schema in about 5 seconds per render.

The relationship diagram generator draws connector lines between entities with crow's foot notation marking cardinality at both endpoints, keeping the web of 1:1, 1:N, and M:N relationships visually traceable. When a layout needs a second pass, adjust your wording and regenerate — a fresh variation arrives in about 5 seconds, versus the 15 to 25 minutes typically spent manually rerouting connectors in drag-and-drop editors.

Save your finished diagram as a crisp PNG — up to 2048px on Standard, a locked 2048px 2K on Pro, and up to 3840px 4K output on Master — large enough for design documents, README pages, and review decks. The er diagram generator online keeps entity labels and relationship lines sharp at full size, removing the 10 to 15 minutes usually lost to post-export reformatting and screenshot cleanup.

Database design, SQL documentation, classroom instruction, and legacy system analysis — scenarios where automated diagram creation saves hours.

Architects describe table structures in plain language — such as Users table with id, email, and role columns linked to Orders via user_id foreign key — and the database er diagram generator produces a cleanly structured schema diagram illustration with the relationships you describe in about 5 seconds. A typical application database with 15 to 25 tables renders in under 10 seconds total, compared to 60 to 90 minutes of manual drawing in Visio or Lucidchart.

Developers paste CREATE TABLE and ALTER TABLE statements from existing projects into the entity relationship diagram from sql feature and receive a complete visual schema reference illustration in roughly 5 seconds. Documenting a 20-table database with 40 to 60 foreign key relationships through manual diagramming in conventional tools consumes 45 to 75 minutes per schema revision cycle.

Instructors write schema descriptions like Student enrolls in Course through Enrollment junction table, and the platform produces a clearly labeled relationship diagram generator output with all entities and cardinality labels in about 5 seconds. A lecture covering 4 to 6 normalization examples renders in under 30 seconds total, compared to 45 to 60 minutes of manual illustration on a whiteboard or in presentation software.

Teams maintaining older systems use the best er diagram tool to paste existing SQL scripts and reconstruct visual documentation for databases with 30 to 50 tables that lost their original diagrams. The platform renders the pasted script into a visual documentation illustration in about 5 seconds, replacing the 2 to 4 hours of manual schema mapping typically required when rediscovering legacy database structures.

Go from written schema descriptions or SQL scripts to a finished diagram in three quick steps.

Enter your table names, column definitions, primary keys, and foreign key relationships in plain text — anything from a single table up to 500 words. Alternatively, paste CREATE TABLE and ALTER TABLE DDL snippets within the same input budget. Richer detail in your input produces a more detailed entity relationship diagram on the first render.

The ai er diagram generator reads your input and draws entity tables with relationship lines and cardinality notation in about 5 seconds. After the initial render, adjust your description and regenerate create er diagram from sql variations in about 5 seconds without starting over.

Review the output, regenerate with tweaked wording until the layout reads right, then save your diagram as a high-resolution PNG. Copy the shareable link to send to colleagues or download the file for your documentation. The entire workflow lets you create entity relationship diagram online and export a finished deliverable in under 30 seconds.

faq.subtitle
Describe your tables, paste your SQL, and export a professional entity relationship diagram in seconds.
Describe your tables or paste SQL to create your first ER diagram.

Other AI-powered diagram tools from Arui.AI — worth a look if you found this one useful.

Turn process descriptions into structured flowcharts with AI-powered connector routing and decision diamonds.
Try Now
Turn role descriptions into structured organizational charts with AI-powered hierarchy mapping.
Try Now
Turn ideas and notes into structured mind maps with automatic branch detection and radial layouts.
Try Now
Turn set descriptions into proportional Venn diagrams with correctly sized circles and labeled intersections.
Try Now